Our Coast Our Future
Client: United States Geological Survey Role: Product Manager and Strategist Product: Responsive Web Duration: 6 Weeks
OVERVIEW
Our Coast, Our Future (OCOF) is a collaborative, user-driven project focused on providing coastal California resource managers with relevant tools to help understand, visualize, and anticipate vulnerabilities to sea level rise. The underlying model, the Coastal Storm Modeling System (CoSMos), will be expanded nationally within three years so the USGS wishes to expand their outreach and market fit.
APPROACH
I created a 20 member team to evaluate the current web platform and the redesign of an intuitive responsive web solution, expanding the accessibility to the public. The USGS still uses the platform for policy presentations, so current functionality was retained through progressive disclosure.
RESULTS
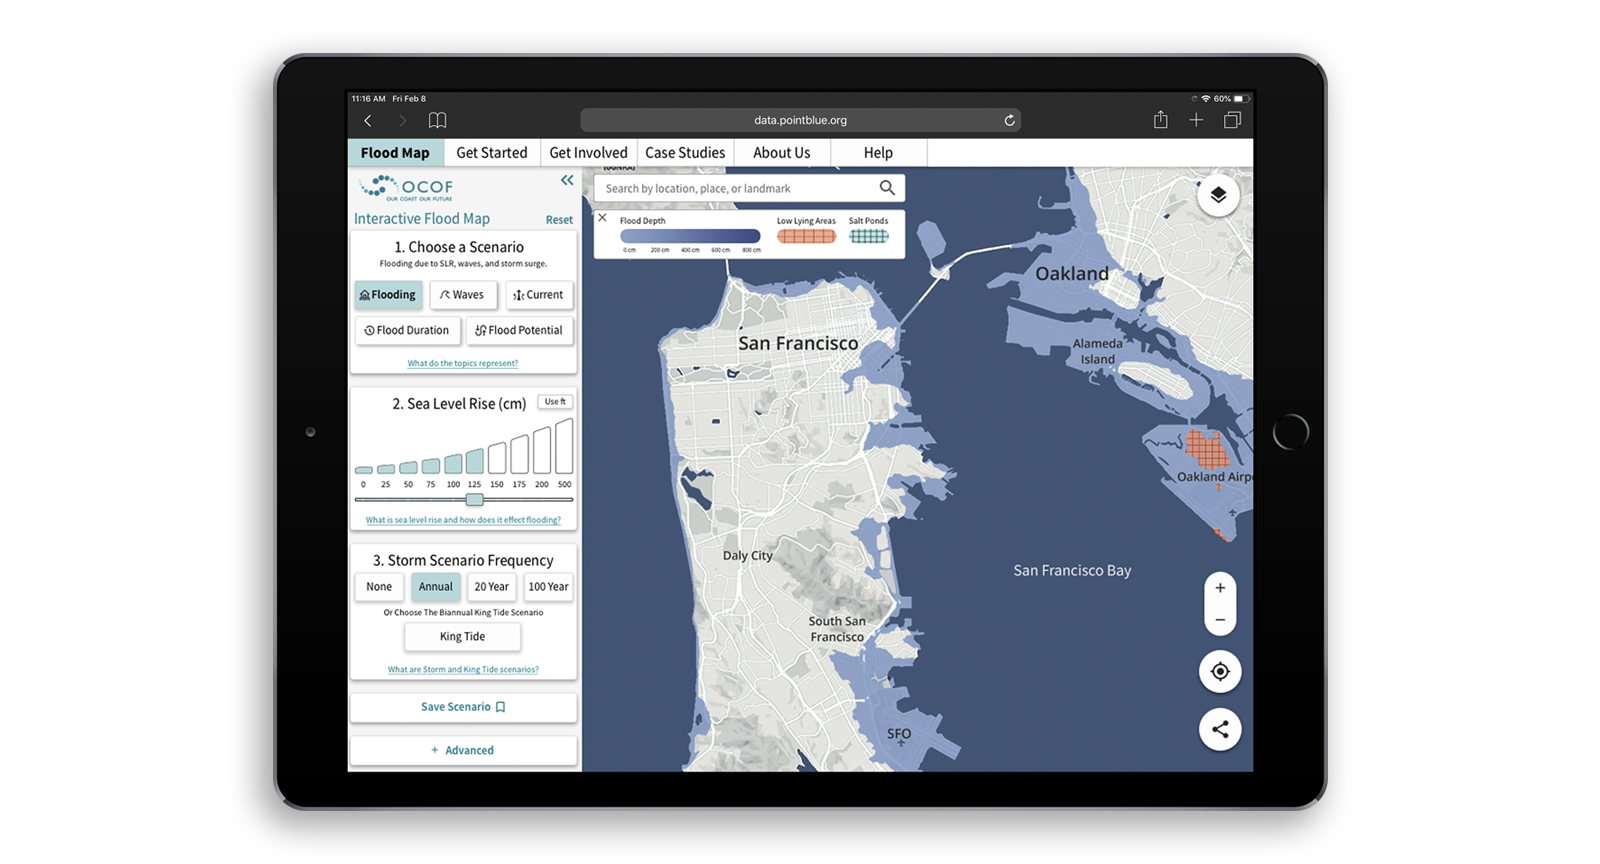
By synthesizing the needs of the USGS and the public, I directed the design of a streamlined OCOF responsive web. The new platform serves all user stories and offers additional content for engagement. Furthermore, I delivered GIS data visualization recommendations to further increase user comprehension.
Product Strategy
The teams were organized into several categories for parallel work over a short 6 week duration. Emphasis was given to communication through shared reports during 2 week cycles. GIS and a third XR branch worked at a slower pace, using evaluations from the responsive web team to generate sprint topics.
RESEARCH: COMPARATIVE
A wide array of mobile platforms were studied to understand the design systems used to serve complex information. Many innovations and successful patterns were found and incorporated. The USGS was encouraging in this area, wanting to find both old and new interactions which lead to a positive feedback loop.
RESEARCH: USABILITY TESTING
The USGS also had issues with retention and comprehension, which was validated by our own UX interviews. A list of user tasks were generated and tested to highlight pain points that could be addressed. Public perception was also documented from this study, and used by the information architecture team to restructure scenario and layer names.
Personas
In conjunction with growth, I created personas to map the goals of our potential users. It should be noted that the USGS has strict advocacy restrictions, so great care was given to synthesize possible solutions that we could implement.
COLOR ACCESSIBILITY
With public outreach being the primary goal, we investigated WCAG and ADA color standards for websites. Nine percent of the U.S population has some level of vision impairment, five percent of which is red/green deficiency. These disabilities can cause confusion with certain color schemes.
TWO STEP VERIFICATION and RESPONSIVE WEB
In an analysis of existing OCOF brand colors, an 8 pt grid system was created with paired values for maximum contrast ratio. We also initiated a two step verification on all interactions. This included font weight, borders, underlines, and bi-color cues. Color contrast ratios chosen were in the 7-8:1 range, well above 4.5:1 AA recommendations.
All of the design decisions were further modified for responsive web. The current web only platform limited public engagement, and a mobile focused solution would disregard the presentation needs of the USGS.
Lo-Fi Mockups & TESTING
Lo-Fi mockups were used to retest initial trials with users along with newly added viral tasks. Designs were mocked on older iPhone models for accessibility testing.
Wire frames and FLOW
Wireframes were used to prototype user flow and help define end goals. Informational sections will be filled by current OCOF copy and additional pathways provided by growth research.
GIS mockups
I created a series of GIS mockups using MapBox studio and extracted visual data from current OCOF maps. Colors were based upon WCAG standards and patterns from the Color Universal Design Organization (CUDO). Final images were presented to the USGS .


Hi-Fi IMAGES
Hi-Fi delivery was created by myself and a small team which synthesized research, Lo-Fi, and growth findings.
Conclusions
Most of the work done during the initial six week schedule occurred during the government shutdown which required teams to reference initial goals at every step. Upon return however, the USGS confirmed the work done not only aligned with the current goals but exceeded expectations. Design decisions enhanced all aspects of the current platform giving new avenues of growth and accessibility. Informational sections targeting user engagement will be featured at a later date.


